


As Bitcoin (BTC) continues to hover around the crucial 200-day simple moving average, currently positioned at ,359, optimistic signs from the market suggest that bullish sentiment might be gaining traction. Despite recent pullbacks, many analysts view this phase as a typical correction that precedes significant rallies, fueling speculation that Bitcoin’s peak is yet to arrive. Nick Forster, founder of Derive, shared with Cointelegraph that the ongoing downturn is standard during prolonged upward trends, reinforcing the belief that Bitcoin could soon breakout from this resistance level.
Interestingly, Bitcoin exchange-traded funds (ETFs) in the U.S. have recently seen a resurgence, with inflows amounting to 5 million since March 14, hinting at renewed investor interest. However, not all experts are sharing in this optimism. Ki Young Ju, founder and CEO of CryptoQuant, indicated in a post that Bitcoin might remain in a bearish or sideways trend for the foreseeable future, suggesting the current bull cycle might have concluded.
“The bulls have not given up much ground,” noted analysts observing the BTC/USDT daily charts. “This indicates that bullish traders are still holding their positions, expecting a significant breakout in the near term.”
Notably, the fluctuations in Bitcoin’s price are reflected in the performances of other major cryptocurrencies. Ether (ETH) has recently surged following a successful upswing, while XRP, BNB, and Solana have also shown signs of potential rallies, albeit with caution advised against resistance levels. Market participants are closely monitoring these trends, analyzing how Bitcoin’s momentum could potentially influence the broader cryptocurrency landscape.
Bitcoin Market Analysis and Its Impact
This article provides an overview of the current trends and analyses within the Bitcoin market, along with insights on several key cryptocurrencies. Here are the main takeaways:
- Bitcoin Holding at Key Support:
- Bitcoin (BTC) is currently clinging to the 200-day simple moving average at ,359.
- This suggests sustained pressure from bulls, potentially leading to an upside breakout.
- Normal Correction Phase:
- Nick Forster from Derive anticipates that the current pullback is a typical correction during Bitcoin’s long-term rallies.
- He expects that Bitcoin’s cycle peak is still to come, which could provide insights for long-term investors.
- Spot Bitcoin ETF Inflows:
- US spot Bitcoin ETFs have seen 5 million in inflows since March 14, indicating renewed interest from institutional investors.
- Caution from Analysts:
- Some experts, like Ki Young Ju from CryptoQuant, predict a potential bearish trend for Bitcoin over the next 6-12 months.
- This could impact investors’ decisions regarding long-term holding or short-term trading strategies.
- Technical Analysis of Major Cryptocurrencies:
- Bitcoin (BTC): Expected to rally if it closes above the 20-day EMA; potential drop below ,606 could suggest further losses.
- Ether (ETH): A rally is possible if it overcomes ,111; failing to maintain above ,800 would indicate bearish control.
- XRP (XRP): Need to hold above .36 to avoid a downward trend towards .
- BNB (BNB): A rebound above 2 suggests bullish sentiment; losses below this level could prompt profit-taking.
- Solana (SOL): Holding above 0 indicates strong buying; below this level could suggest a downtrend.
- Cardano (ADA): Indecision suggests cautious trading; breaking below moving averages could signal a bearish trend.
- Dogecoin (DOGE): Key support at [openai_gpt model=”gpt-4o-mini” prompt=”Based on the article content, generate a list of key points in an HTML format using Bold, UL/OL. Focus solely on the most important aspects, and describe how they might be related or impact the readers life if at all. Begin with a title using
HTML tag in this format: ‘
Title Goes Here
‘. Use only
,
- ,
- , and
tags. DO NOT include a ‘Conclusion’ section! Here is the topic description: ‘Bitcoin (BTC) has been clinging to the 200-day simple moving average ($84,359), which suggests that the bulls have kept up the pressure. That improves the prospects of an upside breakout, signaling the corrective phase may be ending. Derive founder Nick Forster told Cointelegraph that the current pullback is a normal correction that Bitcoin experiences during long-term rallies. He anticipates that Bitcoin’s cycle peak is yet to come.A positive sign in favor of bulls is that the US spot Bitcoin exchange-traded funds (ETFs) have again started to witness inflows. According to Farside Investors data, spot Bitcoin ETFs have recorded $525 million in inflows since March 14.Crypto market data daily view. Source: Coin360However, not everyone is bullish on Bitcoin. CryptoQuant founder and CEO Ki Young Ju said in a post on X that Bitcoin could remain in a bearish or sideways trend for the next 6-12 months as the bull cycle is over.Could Bitcoin break out of the 200-day SMA, triggering a rally in altcoins? Let’s analyze the charts of the top 10 cryptocurrencies to find out.Bitcoin price analysisBitcoin is facing selling at the 200-day SMA, but the bulls have not given up much ground. That suggests the bulls are not dumping their positions as they expect a breakout in the near term.BTC/USDT daily chart. Source: Cointelegraph/TradingViewThe bullish momentum is expected to pick up on a break and close above the 20-day exponential moving average ($85,441). The BTC/USDT pair could then climb to the 50-day SMA ($91,904). This optimistic view will be negated in the near term if the price turns down sharply from the 20-day EMA and breaks below $80,000. The pair may then tumble to $76,606. Buyers are expected to defend the $76,606 to $73,777 zone with all their might.Ether price analysisThe narrow range trading in Ether (ETH) resolved to the upside on March 19, indicating that the bulls have overpowered the bears.ETH/USDT daily chart. Source: Cointelegraph/TradingViewSellers will try to halt the relief rally at the breakdown level of $2,111, but if the bulls prevail, the ETH/USDT pair could ascend to the 50-day SMA ($2,468). If this level is also crossed, the pair could surge to $2,850.Instead, if the price turns down sharply from $2,111, it will signal that the bears are trying to flip the level into resistance. The bears will gain the upper hand if they sink and maintain the price below $1,800.XRP price analysisXRP (XRP) surged above the moving averages on March 19, opening the doors for a rally to the resistance line.XRP/USDT daily chart. Source: Cointelegraph/TradingViewIf the price turns down from the resistance line, the XRP/USDT pair is likely to find support at the 20-day EMA ($2.36). A bounce off the 20-day EMA increases the likelihood of a break above the resistance line. The pair may then climb to $3.On the other hand, if the price turns down from the resistance line and breaks below the moving averages, it heightens the risk of a drop to $2. Sellers will be in control on a close below $2.BNB price analysisBNB (BNB) closed above the 50-day SMA ($618) on March 17, but the bulls are struggling to sustain the higher levels.BNB/USDT daily chart. Source: Cointelegraph/TradingViewThe pullback is expected to find support at the 20-day EMA ($602). If the price rebounds off the 20-day EMA with strength, it will suggest a change in sentiment from selling on rallies to buying on dips. That increases the possibility of a break above $644. The BNB/USDT pair could then rally to $686.Conversely, a break and close below the 20-day EMA suggests that the bulls are booking profits. That may sink the pair to $550.Solana price analysisSolana (SOL) rebounded off the $120 to $110 support zone on March 18, indicating that the bulls are aggressively defending the zone.SOL/USDT daily chart. Source: Cointelegraph/TradingViewIf buyers catapult the price above the 20-day EMA ($137), it will suggest the start of a sustained recovery. The SOL/USDT pair could rally to the 50-day SMA ($167) and, after that, to $180.Contrarily, if the price turns down from the 20-day EMA, it will signal that the bears remain in control. A break below the support zone suggests the start of the next leg of the downtrend. There is minor support at $98, but if the level breaks down, the pair could plummet to $80.Cardano price analysisCardano (ADA) has been trading between the uptrend line and the moving averages for the past few days, indicating indecision about the next directional move.ADA/USDT daily chart. Source: Cointelegraph/TradingViewThe downsloping moving averages and the RSI just below the midpoint give a slight edge to the bears. If the price turns down from the moving averages and breaks below the uptrend line, the ADA/USDT pair could drop to $0.58 and eventually to $0.50.On the contrary, a break and close above the moving averages suggests that the bulls are back in the game. The pair could ascend to $1.02, where the bears are expected to sell aggressively.Dogecoin price analysisDogecoin (DOGE) is facing selling near the 20-day EMA ($0.18), indicating that the bears are active at higher levels.DOGE/USDT daily chart. Source: Cointelegraph/TradingViewThe bears will try to sink the price below the $0.14 support. If they manage to do that, it will signal the resumption of the downtrend. The DOGE/USDT pair could plunge to psychological support at $0.10.If buyers do not give up much ground from the current level, it improves the prospects of a break above the 20-day EMA. If that happens, the pair could climb to $0.25 and thereafter to $0.29.Related: Fund managers dump US stocks at record pace — Can recession fears hurt Bitcoin?Chainlink price analysisChainlink (LINK) has risen to the 20-day EMA ($14.66), but the bulls are expected to face stiff resistance from the bears.LINK/USDT daily chart. Source: Cointelegraph/TradingViewIf the price turns down from the 20-day EMA, the bears will again try to sink the LINK/USDT pair below the $12 support. If they manage to do that, the pair could descend to the crucial support at $10.Alternatively, a break and close above the 20-day EMA suggests that the breakdown below the channel was a bear trap. The pair may climb to the 50-day SMA ($17.22) and later to $19.25.UNUS SED LEO price analysisUNUS SED LEO (LEO) has been trading in a tight range between $10 and $9.60 for the past few days, suggesting that the bulls are holding on to their positions as they anticipate a move higher.LEO/USD daily chart. Source: Cointelegraph/TradingViewIf buyers drive and maintain the price above $10, the LEO/USD pair will complete a bullish ascending triangle pattern. The pair may then start an upmove toward the pattern target of $12.04.Contrary to this assumption, if the price turns down and breaks below $9.60, it will signal that the bulls have given up. The pair may then drop to the uptrend line, which is again expected to attract buyers. Toncoin price analysisToncoin (TON) has been facing resistance at the 50-day SMA ($3.56), but a positive sign is that the bulls have not ceded ground to the bears.TON/USDT daily chart. Source: Cointelegraph/TradingViewThat increases the likelihood of a break and close above the 50-day SMA. If that happens, the TON/USDT pair could climb to $4.50 and then to $5. Sellers are expected to mount a vigorous defense near $5.This positive view will be invalidated in the near term if the price turns down and breaks below the 20-day EMA ($3.26). That will indicate selling at higher levels. The pair may then slump to $3.This article does not contain investment advice or recommendations. Every investment and trading move involves risk, and readers should conduct their own research when making a decision.'”].14; failure to hold could signal a return to downtrend dynamics.
- Chainlink (LINK): Climbing above .66 could indicate a recovery; below suggests further declines.
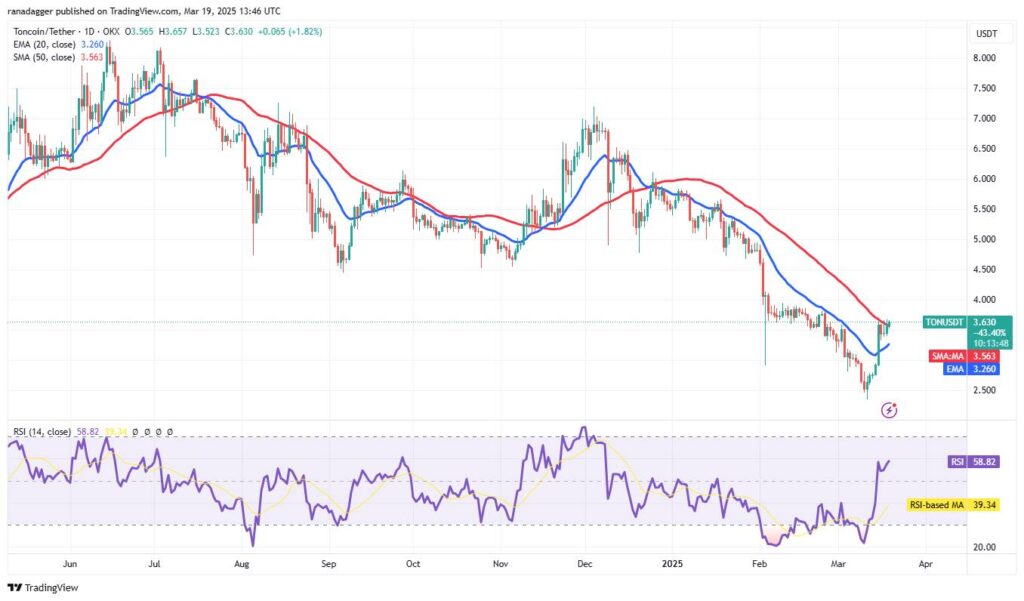
- Toncoin (TON): Potential gains above .56; failure to maintain above 20-day EMA could lead to a downturn.
- ,
- , and
These insights can significantly impact investors’ strategies, from understanding market sentiment to identifying optimal entry and exit points.
Bitcoin’s Battle at the 200-Day SMA: A Comparative Analysis
Bitcoin (BTC) is currently navigating a crucial period, remaining close to its 200-day simple moving average (SMA), set at approximately ,359. This positioning indicates a potentially bullish outlook, as sustained interest from buyers suggests they are not ready to relinquish their stakes just yet. Notably, in the context of cryptocurrency trends, several similar narratives exist that highlight the competitive landscape surrounding Bitcoin’s performance.
Competitive Advantages: Bitcoin’s resilience at the 200-day SMA positions it as a leader in the crypto market. The recent influx of 5 million into US spot Bitcoin ETFs further solidifies its appeal among institutional investors. This trend could rejuvenate confidence among those who view Bitcoin as a store of value, similar to its traditional counterparts in times of economic uncertainty. Moreover, with prominent voices like Derive founder Nick Forster forecasting an impending cycle peak, Bitcoin retains a vibrant narrative that could energize potential investors.
Disadvantages: However, the skepticism from figures like CryptoQuant’s Ki Young Ju introduces a counter-narrative. The notion that Bitcoin might face a prolonged bearish or sideways trend over the next 6-12 months poses risks for traders looking for quick gains. This uncertainty could deter new entrants or casual investors who prefer a more bullish market climate. Additionally, as altcoins react to fluctuations in Bitcoin’s price, the competitive landscape becomes increasingly volatile, with various cryptocurrencies like Ethereum (ETH) and XRP vying for attention.
Who Benefits and Who May Face Challenges: The current situation could favor seasoned investors comfortable with navigating volatility. They might see Bitcoin’s support levels as prime buying opportunities, thus potentially enhancing their portfolios. Conversely, novice traders could find themselves overwhelmed by sudden market shifts, particularly if they enter during a downturn. Furthermore, altcoins could see an array of behaviors contingent upon Bitcoin’s performance; a breakout could spur altcoin rallies, while sustained failures could lead to capitulation in secondary markets, impacting those who have invested heavily in them.
By maintaining a close watch on the key price levels and broader economic factors influencing cryptocurrency trends, investors can make more informed decisions in this dynamic landscape.