


In a striking development within the cryptocurrency landscape, Bitcoin has recently demonstrated a pattern that has piqued the interest of traders and analysts alike: back-to-back weekly hammer candles. This rare occurrence, noted only a handful of times in Bitcoin’s history, signifies a potential turning point in market sentiment and has sparked discussions about future price movements.
These hammer candles, characterized by their unique shape, indicate moments when buyers step in to support the price after a decline, suggesting resilience in the face of selling pressure. This technical indicator often signals a possible reversal, drawing attention from enthusiasts excited about what this might mean for Bitcoin’s trajectory.
“Such patterns have only emerged sporadically in Bitcoin’s past,” explains a recent Elliott Wave update on Bitcoin from March 5, 2025. “The implications of these movements are significant for traders looking to gauge market sentiment.”
Furthermore, experts from various platforms, including CoinDesk and FXStreet, are closely analyzing this phenomenon. The collaboration of insights from analysts like Crypto Eagles reinforces the community’s eagerness to interpret these breaking trends amidst the ever-evolving landscape of digital currencies.
With the backdrop of ongoing debates and developments in cryptocurrency regulations and adoption, Bitcoin’s recent performance serves as a reminder of the volatility and unpredictability that defines this domain. As more analysis emerges, investors and enthusiasts will be watching keenly to see how this pattern unfolds in the context of the broader market.

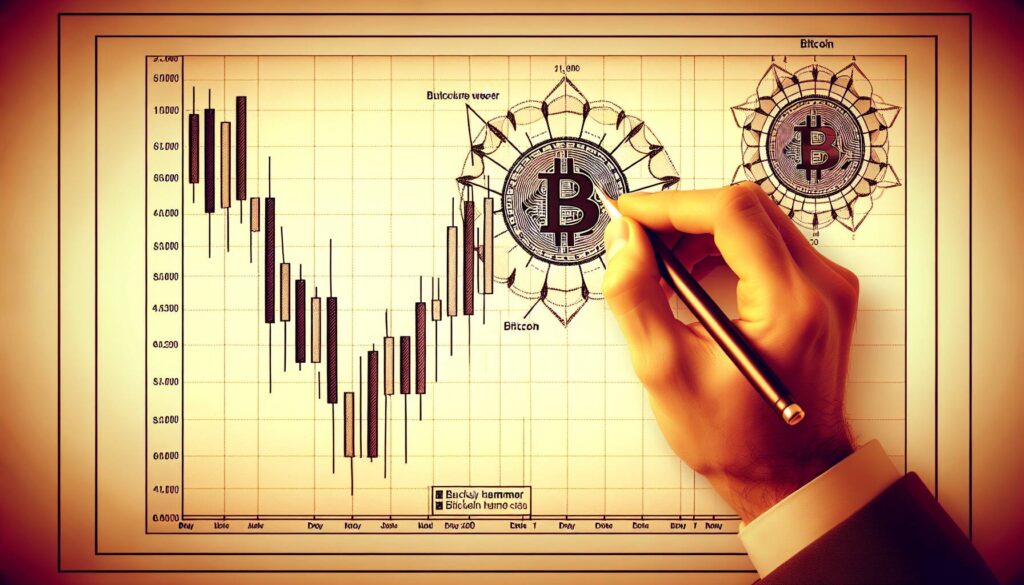
Bitcoin Market Analysis: Weekly Hammer Candles
The recent Bitcoin chart analysis has drawn attention to the emergence of back-to-back weekly hammer candles, a pattern that holds significance in technical trading. Here are the key points from the analysis:
- Weekly Hammer Candles:
- This pattern indicates a potential reversal in market trends, suggesting bullish sentiment may be gaining traction.
- Such formations have been observed only a handful of times in Bitcoin’s history, highlighting their rarity and importance.
- Technical Analysis Insights:
- Current Elliott Wave analysis suggests a possible wave extension, forecasting future price movements based on historical trends.
- Market analysts believe understanding these patterns can equip traders to make informed decisions.
- Impact on Investors:
- Recognizing these patterns may help investors capitalize on potential price increases.
- Timing entry and exit points based on technical analysis could maximize returns and mitigate losses.
- Market Sentiment:
- Investor psychology plays a crucial role; bullish patterns could foster positive sentiment, attracting more investors to the market.
- Increased participation can lead to higher liquidity and volatility, affecting the entire cryptocurrency ecosystem.
Understanding the implications of these technical patterns not only aids traders but also influences decision-making for new investors looking to enter the cryptocurrency market.
Bitcoin’s Hammer Candles: A Rare Technical Signal
The recent revelation that Bitcoin has formed back-to-back weekly hammer candles is drawing significant attention from traders and analysts alike. This occurrence, which has only been seen a few times throughout Bitcoin’s history, presents both opportunities and risks in the current market landscape. As investors look to capitalize on potential price movements, it’s essential to understand how these signals position Bitcoin in comparison to its peers in the cryptocurrency market.
Competitive Advantages
Bitcoin’s hammer candles signify a potential bullish reversal, indicating that despite recent bearish trends, a support level could be establishing itself. Such a technical signal is usually a precursor to future price rises, making it an attractive point for investors seeking to ride the wave of an upward trend. Additionally, the heightened interest in ethical investing has seen Bitcoin gaining traction, especially as more entities are adopting or recommending it. The consolidation of bullish sentiment, combined with the insights provided by analysts like Crypto Eagles, enhances Bitcoin’s appeal over alternative cryptocurrencies that may lack similar technical robustness or historical data.
Competitive Disadvantages
However, with opportunity comes volatility. Bitcoin remains notorious for its price swings, and the hammer candle formation does not guarantee sustained upward momentum. Compared to lesser-known cryptocurrencies, this unpredictability could dissuade risk-averse investors. Furthermore, as regulatory scrutiny grows globally, Bitcoin could face challenges that its altcoin counterparts might navigate more easily due to lower profiles. The recent insights from sources like CoinDesk and FXStreet, while informative, are part of a larger noise in a crowded market that may drown out critical signals for some traders.
Implications for Investors
Traders with a higher risk tolerance could find the hammer candle formation a lucrative opportunity, particularly as they may perceive it as a signal for impending growth. Conversely, cautious investors should tread carefully; they may find Bitcoin’s erratic movements a source of anxiety. Additionally, institutions looking to anchor their portfolios in more stable assets might find Bitcoin’s volatility a concern, complicating their adoption strategies. Overall, while Bitcoin’s recent technical developments provide intriguing possibilities, they also underscore the importance of a well-researched approach in this fluctuating market landscape.