


Bitcoin (BTC) is currently experiencing a significant retreat from the important ,000 level, raising concerns that demand is waning as prices climb. This shift coincides with market jitters surrounding recent US trade tariffs and inflation pressures, notably reflected in the latest Personal Consumption Expenditures data, which outpaced expectations. Investors are left grappling with contrasting forecasts for Bitcoin’s future, as analysis from the prediction markets platform Polymarket shows potential price targets for 2025 ranging from a bearish ,040 to a bullish 8,617.
“Despite the uncertainty, Real Vision’s chief crypto analyst Jamie Coutts expresses optimism for Bitcoin,” reported Cointelegraph. “He predicts a possible surge to a new all-time high above 9,000 by the second quarter.”
As Bitcoin faces critical support levels, attention shifts to other major cryptocurrencies. Ether (ETH), for instance, has slipped below its 20-day exponential moving average, indicating a dominant bearish sentiment. Meanwhile, XRP and BNB are also contending with their own pressures, with key resistance and support levels active within their price charts.
This landscape reveals a mixed sentiment among traders, with many watching closely for any shifts that could signal a resurgence or further decline across the crypto market. Understanding these dynamics is essential as investors navigate the complexities of cryptocurrency trading in light of evolving economic indicators and geopolitical issues.
Bitcoin Market Analysis and Key Insights
The current trends in the cryptocurrency market, especially Bitcoin, indicate significant factors that could impact both traders and investors. Here are the most critical points to consider:
- Bitcoin’s Price Resistance:
- Bitcoin has struggled to maintain above the crucial ,000 mark.
- Recent analysis suggests support levels at ,000 and below, with potential downward movement to ,606.
- Market Sentiment:
- Nervousness among investors due to US trade tariffs and inflation concerns.
- The US Personal Consumption Expenditures data exceeded expectations, increasing market volatility.
- Price Predictions for 2025:
- Bearish prediction for Bitcoin at ,040.
- Optimistic projection could see Bitcoin reach around 8,617.
- Analyst Outlook:
- Chief crypto analyst Jamie Coutts predicts a possible new all-time high above 9,000 by Q2.
- He remains bullish despite uncertainty regarding tariffs and recession fears.
- Other Cryptocurrency Updates:
- Ethereum (ETH): Struggling with resistance at ,111, potential to drop to ,800.
- XRP: Critical support at , failure to hold may lead to a drop towards .27.
- Dogecoin (DOGE): Expected to remain range-bound between [openai_gpt model=”gpt-4o-mini” prompt=”Based on the article content, generate a list of key points in an HTML format using Bold, UL/OL. Focus solely on the most important aspects, and describe how they might be related or impact the readers life if at all. Begin with a title using
HTML tag in this format: ‘
Title Goes Here
‘. Use only
,
- ,
- , and
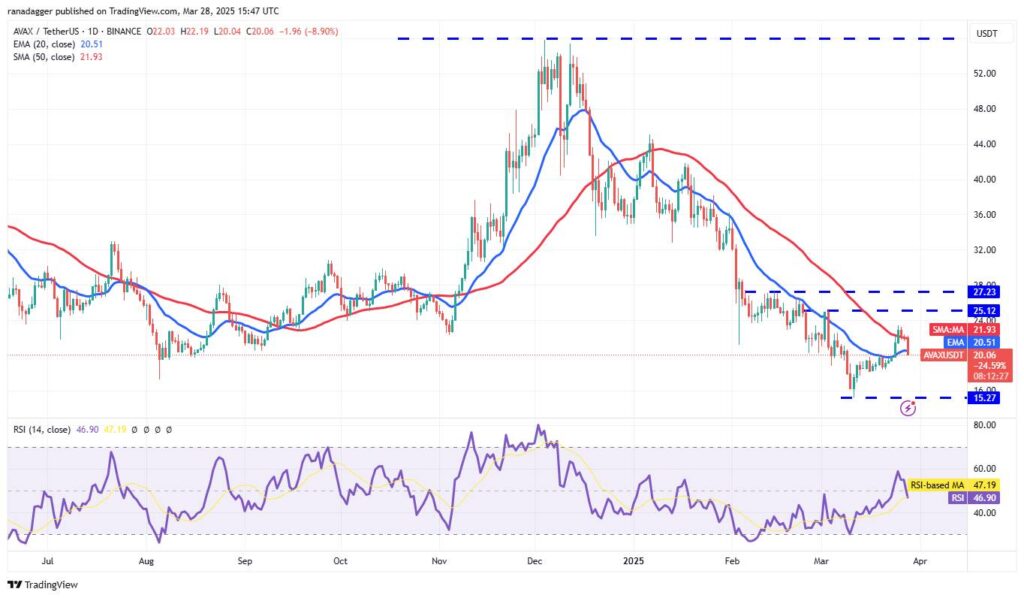
and [openai_gpt model=”gpt-4o-mini” prompt=”Based on the article content, generate a list of key points in an HTML format using Bold, UL/OL. Focus solely on the most important aspects, and describe how they might be related or impact the readers life if at all. Begin with a title usingtags. DO NOT include a ‘Conclusion’ section! Here is the topic description: ‘Bitcoin (BTC) is moving farther away from the crucial $90,000 mark, indicating that buying dries up at higher levels. Market participants seem nervous about the fresh round of US trade tariffs and the renewed inflation pressure as US Personal Consumption Expenditures data came in hotter-than-expected.Traders are divided about Bitcoin’s price trajectory in 2025. Analyzing data from the prediction markets platform Polymarket, X user Ashwin highlighted that Bitcoin’s most bearish target for 2025 is $59,040, and the most bullish is $138,617.Crypto market data daily view. Source: Coin360Although the near-term remains uncertain, Real Vision chief crypto analyst Jamie Coutts remains bullish on Bitcoin. Coutts told Cointelegraph that Bitcoin could hit a new all-time high above $109,000 before the end of the second quarter. He added that a lack of clarity on the US tariffs and recession concerns are unlikely to derail the potential Bitcoin rally.What are the important support levels to watch out for in Bitcoin and the major altcoins? Let’s analyze the charts of the top 10 cryptocurrencies to find out.Bitcoin price analysisBitcoin turned down from the resistance line and broke below the 20-day exponential moving average ($85,765) on March 28.BTC/USDT daily chart. Source: Cointelegraph/TradingViewThe bears will try to pull the price below the immediate support at $83,000. If they do that, the BTC/USDT pair could slide to $81,000 and later to $80,000. Buyers are expected to fiercely defend the zone between $76,606 and $80,000.The bulls will have to push and maintain the price above the resistance line to signal that the correction may be ending. A close above the 50-day simple moving average ($89,346) could propel the pair to $95,000 and eventually to the psychological resistance at $100,000.Ether price analysisEther (ETH) turned down from the breakdown level of $2,111 and broke below the 20-day EMA ($2,032), indicating that the bears remain in control.ETH/USDT daily chart. Source: Cointelegraph/TradingViewSellers will try to sink the ETH/USDT pair to the $1,800 to $1,754 support zone. Buyers are expected to vigorously defend the zone because a break below it could resume the downtrend. The next stop on the downside could be $1,550.Buyers will have to push and sustain the price above $2,111 to signal that the bearish momentum is weakening. The 50-day SMA ($2,293) may act as a hurdle on the upside, but if taken out, the pair could rally to $2,550.XRP price analysisXRP (XRP) turned down and broke below the moving averages on March 26, indicating that the bears remain sellers on every minor rise.XRP/USDT daily chart. Source: Cointelegraph/TradingViewThe bears will try to sink the price to the vital support at $2. Buyers are expected to defend the level with all their might because a break below $2 will complete a bearish head-and-shoulders pattern. The XRP/USDT pair may then plunge to $1.27.On the contrary, a strong bounce off the $2 support could keep the pair stuck inside the triangle for a while longer. The bulls will be back in the driver’s seat on a break and close above the resistance line.BNB price analysisBNB (BNB) has been trading between the moving averages and the $644 resistance for the past few days.BNB/USDT daily chart. Source: Cointelegraph/TradingViewThe upsloping 20-day EMA ($618) and the RSI in the positive territory signal a slight advantage to buyers. If the price rebounds off the moving averages with strength, it improves the prospects of a break above $644. The BNB/USDT pair could then surge to $686.Contrary to this assumption, if the price continues lower and breaks below the moving averages, it indicates that the bulls have given up. The pair may descend to the 38.2% Fibonacci retracement level of $591.Solana price analysisSolana (SOL) broke below the 20-day EMA ($136) on March 28, suggesting a lack of demand from the bulls.SOL/USDT daily chart. Source: Cointelegraph/TradingViewSellers will try to sink the price to the $120 to $110 support zone. Buyers are expected to defend the support zone aggressively because a break and close below it could resume the downtrend toward $80.The 50-day SMA ($153) is the critical overhead resistance to watch out for. Buyers will have to kick the price above the 50-day SMA to indicate that the SOL/USDT pair may have formed a floor at $110. The pair could then jump to $180.Dogecoin price analysisDogecoin (DOGE) turned down from the 50-day SMA ($0.21) on March 26, indicating that the sentiment remains negative.DOGE/USDT daily chart. Source: Cointelegraph/TradingViewThe flattish 20-day EMA ($0.18) and the RSI just below the midpoint suggest a range-bound action in the near term. The DOGE/USDT pair could swing between $0.14 and the 50-day SMA for some time.If the price turns up from the current level and breaks above the 50-day SMA, it will signal that the bulls are trying to form a higher low. That increases the possibility of a break above the 50-day SMA. The pair may ascend to $0.24 and later to $0.29.Cardano price analysisCardano’s (ADA) failure to sustain above the 50-day SMA ($0.75) may have attracted profit booking by short-term buyers.ADA/USDT daily chart. Source: Cointelegraph/TradingViewThe ADA/USDT pair could slip to the uptrend line, where the buyers are expected to step in. If the price rebounds off the uptrend line, the bulls will again attempt to drive the pair above the 50-day SMA. If they succeed, the pair may rise to $0.84 and then to $1.02.Contrarily, a break and close below the uptrend line suggests that the bears have overpowered the bulls. The pair may drop to the $0.58 to $0.50 support zone, which is likely to attract buyers.Related: XRP price may drop another 40% as Trump tariffs spook risk tradersToncoin price analysisToncoin (TON) turned up from the 20-day EMA ($3.54) on March 26 and reached the overhead resistance of $4.14 on March 27.TON/USD daily chart. Source: Cointelegraph/TradingViewThe upsloping 20-day EMA and the RSI in the positive territory indicate advantage to buyers. If the price turns up from the current level or the 20-day EMA, it increases the likelihood of a break above $4.14. That opens the doors for a rise to $5.This positive view will be invalidated in the near term if the price breaks below the moving averages. There is minor support at $3.32, but if the level cracks, the TON/USDT pair could slide to $2.81.Chainlink price analysisChainlink (LINK) turned down from the 50-day SMA ($15.96) on March 28 and broke below the 20-day EMA ($14.76), indicating that bears are selling on rallies.LINK/USDT daily chart. Source: Cointelegraph/TradingViewIf the price sustains below the 20-day EMA, the bears will try to strengthen their position by pulling the LINK/USDT pair toward the support line. A break and close below the support line could sink the pair to $10.Buyers are likely to have other plans. They will try to quickly arrest the decline and push the price above the 50-day SMA. If they manage to do that, the pair could climb to $17.70 and subsequently to the resistance line.Avalanche price analysisAvalanche (AVAX) failed to sustain above the 50-day SMA ($21.93), signaling that the bears are active at higher levels.AVAX/USDT daily chart. Source: Cointelegraph/TradingViewThe 20-day EMA ($20.51) is the critical support to watch out for. If the price closes below the 20-day EMA, the AVAX/USDT pair could skid to $18. Buyers are expected to defend the $18 level, but if the bears prevail, the pair could retest the critical support at $15.27.The first sign of strength will be a break and close above the 50-day SMA. That suggests solid buying at lower levels. The pair may then attempt a rally to the $25.12 to $27.23 overhead resistance zone.This article does not contain investment advice or recommendations. Every investment and trading move involves risk, and readers should conduct their own research when making a decision.'”].14
HTML tag in this format: ‘
Title Goes Here
‘. Use only
,
- ,
- , and
.tags. DO NOT include a ‘Conclusion’ section! Here is the topic description: ‘Bitcoin (BTC) is moving farther away from the crucial $90,000 mark, indicating that buying dries up at higher levels. Market participants seem nervous about the fresh round of US trade tariffs and the renewed inflation pressure as US Personal Consumption Expenditures data came in hotter-than-expected.Traders are divided about Bitcoin’s price trajectory in 2025. Analyzing data from the prediction markets platform Polymarket, X user Ashwin highlighted that Bitcoin’s most bearish target for 2025 is $59,040, and the most bullish is $138,617.Crypto market data daily view. Source: Coin360Although the near-term remains uncertain, Real Vision chief crypto analyst Jamie Coutts remains bullish on Bitcoin. Coutts told Cointelegraph that Bitcoin could hit a new all-time high above $109,000 before the end of the second quarter. He added that a lack of clarity on the US tariffs and recession concerns are unlikely to derail the potential Bitcoin rally.What are the important support levels to watch out for in Bitcoin and the major altcoins? Let’s analyze the charts of the top 10 cryptocurrencies to find out.Bitcoin price analysisBitcoin turned down from the resistance line and broke below the 20-day exponential moving average ($85,765) on March 28.BTC/USDT daily chart. Source: Cointelegraph/TradingViewThe bears will try to pull the price below the immediate support at $83,000. If they do that, the BTC/USDT pair could slide to $81,000 and later to $80,000. Buyers are expected to fiercely defend the zone between $76,606 and $80,000.The bulls will have to push and maintain the price above the resistance line to signal that the correction may be ending. A close above the 50-day simple moving average ($89,346) could propel the pair to $95,000 and eventually to the psychological resistance at $100,000.Ether price analysisEther (ETH) turned down from the breakdown level of $2,111 and broke below the 20-day EMA ($2,032), indicating that the bears remain in control.ETH/USDT daily chart. Source: Cointelegraph/TradingViewSellers will try to sink the ETH/USDT pair to the $1,800 to $1,754 support zone. Buyers are expected to vigorously defend the zone because a break below it could resume the downtrend. The next stop on the downside could be $1,550.Buyers will have to push and sustain the price above $2,111 to signal that the bearish momentum is weakening. The 50-day SMA ($2,293) may act as a hurdle on the upside, but if taken out, the pair could rally to $2,550.XRP price analysisXRP (XRP) turned down and broke below the moving averages on March 26, indicating that the bears remain sellers on every minor rise.XRP/USDT daily chart. Source: Cointelegraph/TradingViewThe bears will try to sink the price to the vital support at $2. Buyers are expected to defend the level with all their might because a break below $2 will complete a bearish head-and-shoulders pattern. The XRP/USDT pair may then plunge to $1.27.On the contrary, a strong bounce off the $2 support could keep the pair stuck inside the triangle for a while longer. The bulls will be back in the driver’s seat on a break and close above the resistance line.BNB price analysisBNB (BNB) has been trading between the moving averages and the $644 resistance for the past few days.BNB/USDT daily chart. Source: Cointelegraph/TradingViewThe upsloping 20-day EMA ($618) and the RSI in the positive territory signal a slight advantage to buyers. If the price rebounds off the moving averages with strength, it improves the prospects of a break above $644. The BNB/USDT pair could then surge to $686.Contrary to this assumption, if the price continues lower and breaks below the moving averages, it indicates that the bulls have given up. The pair may descend to the 38.2% Fibonacci retracement level of $591.Solana price analysisSolana (SOL) broke below the 20-day EMA ($136) on March 28, suggesting a lack of demand from the bulls.SOL/USDT daily chart. Source: Cointelegraph/TradingViewSellers will try to sink the price to the $120 to $110 support zone. Buyers are expected to defend the support zone aggressively because a break and close below it could resume the downtrend toward $80.The 50-day SMA ($153) is the critical overhead resistance to watch out for. Buyers will have to kick the price above the 50-day SMA to indicate that the SOL/USDT pair may have formed a floor at $110. The pair could then jump to $180.Dogecoin price analysisDogecoin (DOGE) turned down from the 50-day SMA ($0.21) on March 26, indicating that the sentiment remains negative.DOGE/USDT daily chart. Source: Cointelegraph/TradingViewThe flattish 20-day EMA ($0.18) and the RSI just below the midpoint suggest a range-bound action in the near term. The DOGE/USDT pair could swing between $0.14 and the 50-day SMA for some time.If the price turns up from the current level and breaks above the 50-day SMA, it will signal that the bulls are trying to form a higher low. That increases the possibility of a break above the 50-day SMA. The pair may ascend to $0.24 and later to $0.29.Cardano price analysisCardano’s (ADA) failure to sustain above the 50-day SMA ($0.75) may have attracted profit booking by short-term buyers.ADA/USDT daily chart. Source: Cointelegraph/TradingViewThe ADA/USDT pair could slip to the uptrend line, where the buyers are expected to step in. If the price rebounds off the uptrend line, the bulls will again attempt to drive the pair above the 50-day SMA. If they succeed, the pair may rise to $0.84 and then to $1.02.Contrarily, a break and close below the uptrend line suggests that the bears have overpowered the bulls. The pair may drop to the $0.58 to $0.50 support zone, which is likely to attract buyers.Related: XRP price may drop another 40% as Trump tariffs spook risk tradersToncoin price analysisToncoin (TON) turned up from the 20-day EMA ($3.54) on March 26 and reached the overhead resistance of $4.14 on March 27.TON/USD daily chart. Source: Cointelegraph/TradingViewThe upsloping 20-day EMA and the RSI in the positive territory indicate advantage to buyers. If the price turns up from the current level or the 20-day EMA, it increases the likelihood of a break above $4.14. That opens the doors for a rise to $5.This positive view will be invalidated in the near term if the price breaks below the moving averages. There is minor support at $3.32, but if the level cracks, the TON/USDT pair could slide to $2.81.Chainlink price analysisChainlink (LINK) turned down from the 50-day SMA ($15.96) on March 28 and broke below the 20-day EMA ($14.76), indicating that bears are selling on rallies.LINK/USDT daily chart. Source: Cointelegraph/TradingViewIf the price sustains below the 20-day EMA, the bears will try to strengthen their position by pulling the LINK/USDT pair toward the support line. A break and close below the support line could sink the pair to $10.Buyers are likely to have other plans. They will try to quickly arrest the decline and push the price above the 50-day SMA. If they manage to do that, the pair could climb to $17.70 and subsequently to the resistance line.Avalanche price analysisAvalanche (AVAX) failed to sustain above the 50-day SMA ($21.93), signaling that the bears are active at higher levels.AVAX/USDT daily chart. Source: Cointelegraph/TradingViewThe 20-day EMA ($20.51) is the critical support to watch out for. If the price closes below the 20-day EMA, the AVAX/USDT pair could skid to $18. Buyers are expected to defend the $18 level, but if the bears prevail, the pair could retest the critical support at $15.27.The first sign of strength will be a break and close above the 50-day SMA. That suggests solid buying at lower levels. The pair may then attempt a rally to the $25.12 to $27.23 overhead resistance zone.This article does not contain investment advice or recommendations. Every investment and trading move involves risk, and readers should conduct their own research when making a decision.'”].21
- ,
- , and
- ,
If you are an active trader or investor, these insights emphasize the importance of monitoring support levels and market sentiment in order to make informed investment decisions in a volatile environment.
Bitcoin’s Market Fluctuations Amidst Economic Turmoil
The current landscape for Bitcoin (BTC) presents a mixed bag of opportunities and challenges for investors. While traders are contending with recent economic pressures stemming from US trade tariffs and rising inflation, the digital currency’s journey away from the pivotal ,000 threshold reflects a cautious market sentiment. This pivot point is also echoed in the predictions from Polymarket, indicating a broad range of price expectations for 2025—from a bearish ,040 to a bullish high reaching 8,617. This divergence in forecast indicates the uncertainty clouding Bitcoin’s future, a reality that investors must grapple with.
Competitive Advantage: Notably, Jamie Coutts from Real Vision maintains an optimistic outlook, forecasting a potential new all-time high above 9,000 by the end of Q2. This semblance of positive sentiment amidst market hesitation can act as a beacon for bullish investors, suggesting that opportunities still exist if Bitcoin can establish a robust upward trend. The expected buying pressure around key support levels such as ,606 to ,000 could also present a crucial opportunity for savvy investors looking to capitalize on dips.
Disadvantages: On the flip side, the overwhelming anxiety surrounding economic indicators and tariffs could severely inhibit buying momentum. As recent price movements show decreasing support at higher levels, the scarcity of buyers could further exacerbate downward trends. For those with a vested interest in crypto, particularly Bitcoin, the ongoing volatility and bearish pressure from various altcoins—such as Ethereum (ETH) and XRP—may serve as a constant reminder of the inherent risks involved.
This landscape could benefit swing traders and short-term investors who thrive on volatility and are adept at navigating market shifts. However, long-term holders could find themselves at a disadvantage if Bitcoin continues to falter in an economy that remains tumultuous. Moreover, new entrants might face significant pressure as they attempt to make sense of price fluctuations and market sentiment, making education and informed decision-making crucial in these times.
- , and